Assignment 1 - Lemniscates
Faith Hoyt
Consider two points (3,4) and (-5,-2). For any point (x,y) we can write the distance equations for these as
Distance 1 = ![]()
Distance 2 = ![]()
Exploration of the graphs.
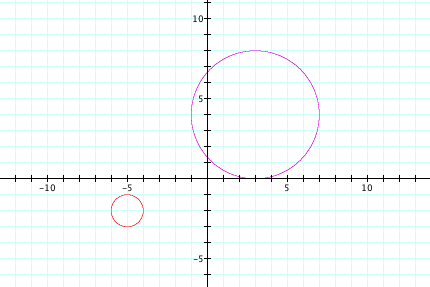
If we simply graph these two equations, each is a circle with a center at their respective points. In other words, the first equation will give me a circle that is centered at (3,4) and if I set it equal to one, the radius will be one. If I were to set it equal to 4, the radius of the circle would be 4 (the purple circle below). The same is true for our second distance formula. This time, the circles will be centered at (-5,-2) where if we set it equal to 1, the radius will be 1(the red circle below).
Now, let’s consider the sum of the two distances for varying values of C.
![]() +
+ ![]() = C
= C
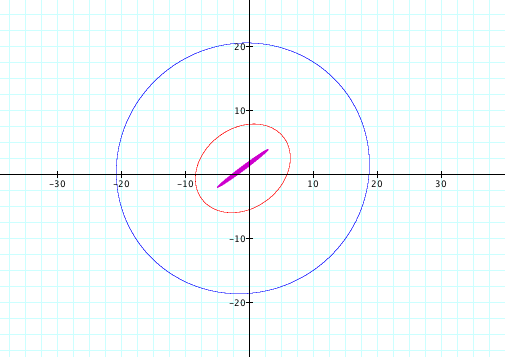
The first type of graph I looked at for this was setting C =1. However, it would not let me graph the ellipse as it said it was out of range. So, next I tried setting c = 4 and 9 and again got the same message. However, I finally set it equal to 10 and got a solid, skinny ellipse (purple on the graph). As I set c equal to increasing numbers, the ellipse began to widen and spread out, looking more like an ellipse that we are used to. After I set it equal to 10 I then tried c=16 (the red graph). As the numbers got higher, I noticed that the sum begins to look like a circle. So then I set c = 40 (the blue graph).
![]()
![]()
![]()
Next, let’s consider the product for various values of c.
![]() *
*![]() = C
= C
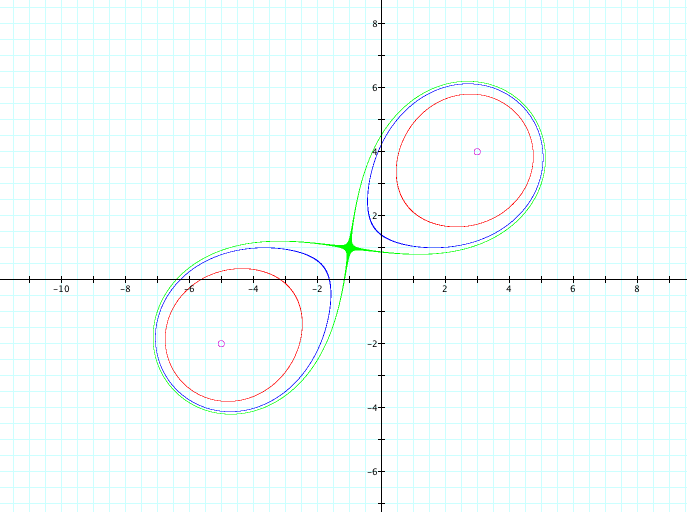
In graphing this new equation, there were a lot of differences. When I set c = 1, there were two small circles that were graphed, one in the first quadrant and one in the third quadrant. With each increase in c value, the circles got bigger. That held true until around c=15. I noticed that one side of each circle began to look oblongated. So I kept investigating. At c=20, this difference really began to be recognizable. At c =24, the two parts of the circle seem to be drawing to each other, almost as if they were magnetic. Now, at c=25, the two circles join and create a lemniscate.
![]()
![]()
![]()
![]()
However, the moment you move onto a larger number, the lemniscates comes apart and becomes one shape that looks as thought it is beginning to stretch out. By c = 50, the shape begins to look more like an ellipse, as we saw earlier in our sum. As we increase to the point of c = 100, our shape once again looks like an ellipse, similar to our previous investigations.
![]()
![]()
![]()
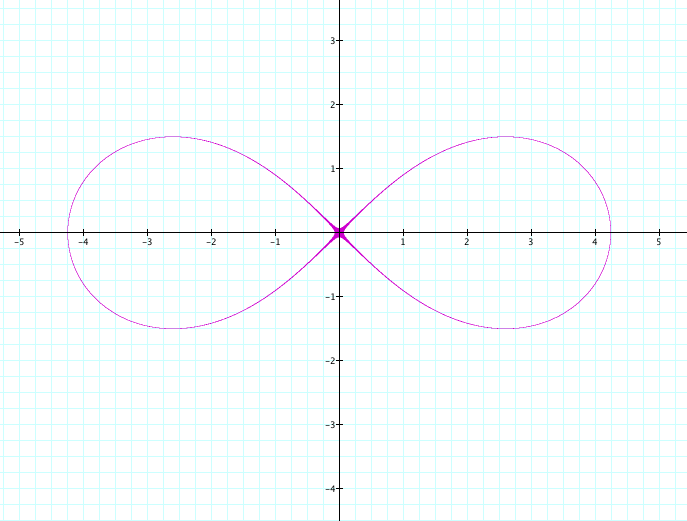
Now, if the two given points are (-a,0) and (a,0) then the lemniscates has its center at the origin (0,0) and major axis along the x-axis. For example, let a = 3. Then ![]() will be the following lemniscate:
will be the following lemniscate:
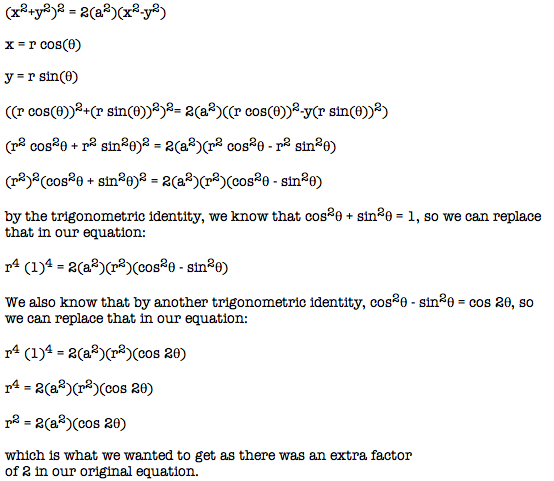
Show that ![]() can be simplified to
can be simplified to ![]() .
.
In general, if the foci of the lemniscate are (-a, 0) and (a, 0) then the equation in Cartesian coordinates is ![]()
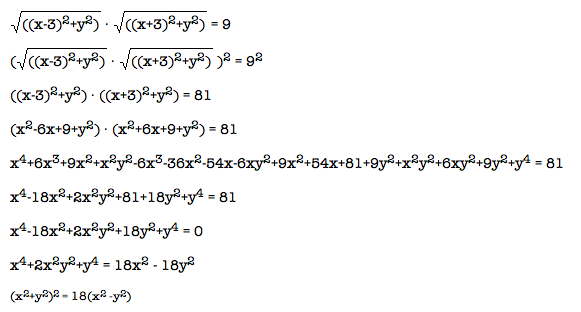
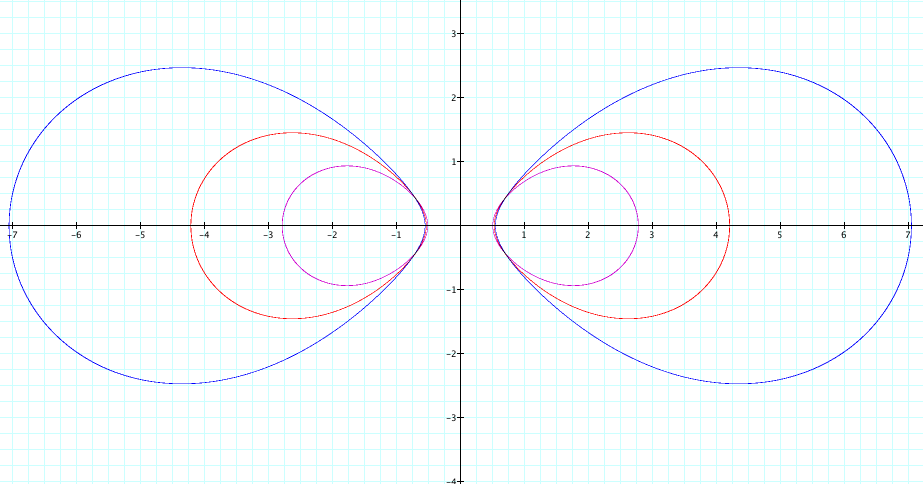
Try graphs for different values of a.
If we let a=2, we can see that the lemniscates gets proportionally larger. Similarly, for each increase in integer, the lemniscates gets both longer (or wider) and fatter(or higher) at the same time and seems to be proportional in its expansion. Notice, that since our a is squared, the same result is the case for a positive or a negative value. If we plug in a=10, the lemniscates again grows proportionally larger at a scale of 10.
![]()
![]()
![]()
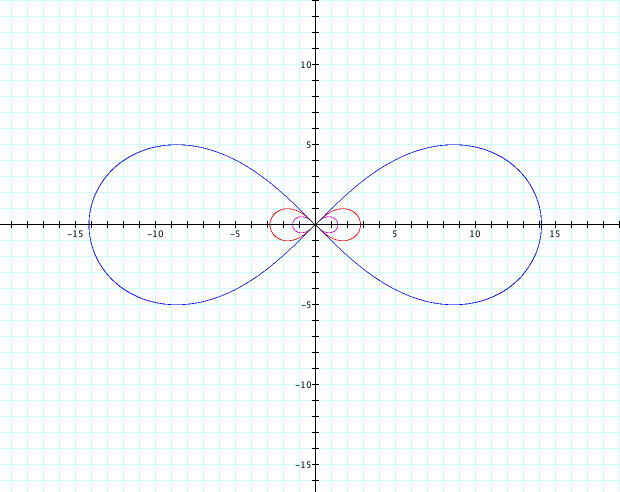
If we do a slight modification by adding b to the end of our above equation, we get a much different graph. Rather than a lemniscates that intersects at the origin, the shape does not cross and rather looks more like a peanut. Let’s try different values of a and b and see how this affects the graph.
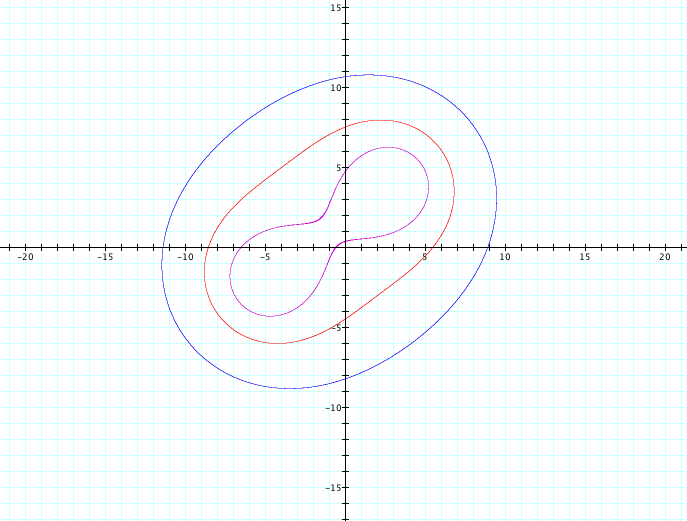
Let a = 1 and b =1, the shape looks like a fat peanut (purple graph). Now, if we change b to be equal to 2 (red graph), the indention that was on the sides of the “peanut” straightens out. If a=2 and b=2 (blue graph), our shape begins to look more like a lemniscates as the indentions start to get closer to the origin. Let’s let a=5 and b=10 (green graph). We notice that this shape is similar to the previous shape in that it is beginning to look more like a lemniscates as it did when b was equal to zero in our previous investigation. With increasing values of both a and b, our shape gets closer to looking like a lemniscates. We can notice that when we change the value of a, it affects the growth of the shape in both the width and height. It also determines how close to crossing at the origin the shape is. In other words, with each increasing value of a, the middle part of the lemniscate is getting closer to intersecting. As we change the value of b positively, it affects the thickness of the shape proportionally.
![]()
![]()
![]()
![]()
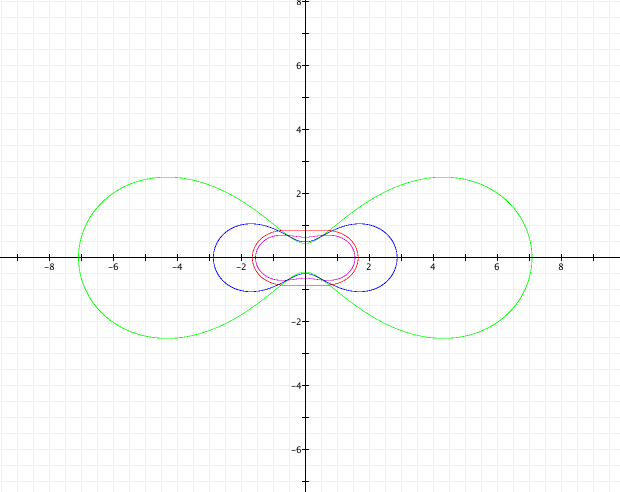
Now, because b is not squared, we need to look at both positive and negative values. With negative values, it splits the shape into two pieces. When we have b equal to a negative, the value of a must be greater than the absolute value of that b. In other words, if we have b=2 a cannot be equal to 1. Thus, when we increase both a and b, the shape begins to evolve into a lemniscates and both halves or sides get larger proportionally. If we have a negative b and as we increase our a value, the two pieces begin to grow larger and closer to each other until eventually they form a lemniscates.
![]()
![]()
![]()
Now, we want to translate our equation into polar coordinates:
![]()
Recall that the equation of a lemniscates in Cartesian coordinates is ![]() and in polar coordinates it’s
and in polar coordinates it’s ![]() .
.
So, we have our above equation that we want to convert to polar coordinates. To do this, we simply do the following:
Thus, we can see that we can pretty easily convert our equation we have been manipulating into polar coordinates.